

How To Follow Candlestick Pattern For Trading In The Crypto Market?
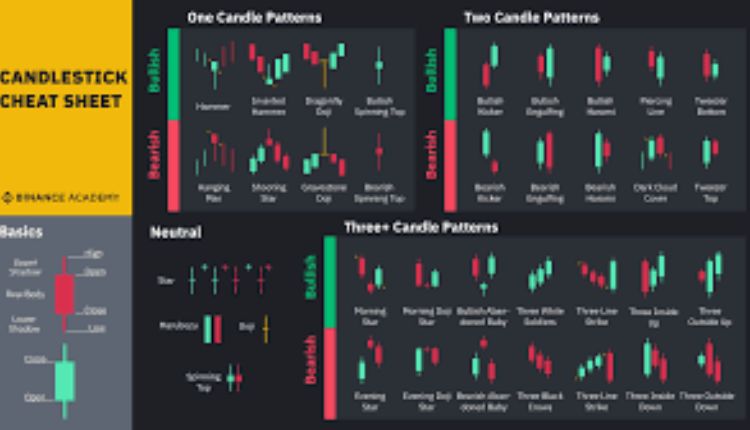
A bullish engulfing pattern is a powerful indicator of upward momentum. This pattern appears when a green candle engulfs a red candle. It indicates that the market has started lower and has sailed past its previous period’s high. If the second candle is similar to the first, it shows strong upward momentum. There should be little visible wick on either side of the candle.
To make the most of this trading pattern, you must first understand how it forms. Tweezer tops are most likely to form at the end of an uptrend. When they form, the price moves in the opposite direction of the prevailing trend. Therefore, you must be aware of this and place your stop loss accordingly.
Identifying Candlestick Patterns
Candlestick charts have been around for years. In the 18th century, a Japanese businessman named Munehisa Homma used them to track rice contracts. This method allowed him to take psychological factors into account when making trading decisions. Today, candlestick charts are a valuable resource for traders. Candlestick charts are the backbone of technical analysis, as they provide crucial data about price action.
The candlestick is a visually appealing, colored price bar, which skilled traders can easily interpret. By analyzing these patterns, you can discern patterns of growth support and resistance. Prices fluctuate between bearish resistance and bullish support, and by watching this ebb and flow, you can spot a trend that is forming.
When you observe a bearish engulfing pattern in an uptrend, for example, you may expect a price drop over the next few trading sessions. In contrast, when you see a bullish continuation pattern, you know that the price will continue to rise.
Identifying Reversal Patterns
Identifying reversal candlestick pattern can be one of the most exciting aspects of trading. It can also help you lock in profits from existing positions. It requires a bit of detective work and looking for technical signals. In this article, we will go over four types of scans that can help you identify reversals. Candlestick patterns are best used in slower timeframes. While technical indicators chart based on price information, candlestick patterns are simpler and more direct.
Reversals typically start with a sudden price change and high volume. This can be either bullish or bearish. A bearish reversal requires a negative percent change. In order to find reversal patterns, traders can analyze the RSI and price action. They can also use other technical indicators to confirm the reversal.
Identifying Continuation Patterns
Identifying continuation patterns is a good way to predict a trend and enter a trade. These patterns have several distinct characteristics. The most important one is the presence of a strong trend and a temporary pause. These pauses can take many forms, but the most common are flags, pennants, rectangles, and triangles. Another key feature of a pattern is the breakout. This is the main signal of a trade and can help you determine your entry and exit. It also helps you determine your stop loss and take profit.
Another great advantage of learning to recognize continuation patterns is that they give you a logical reason for the price’s move. Knowing how to recognize and use these patterns can give you confidence to stay in a trade or enter a new one. These patterns are very common in the financial markets and can be a great addition to your trading arsenal. Identifying tweezer top trading patterns can be a lucrative way to trade in the crypto market.
Trading With Hammer
A hammer candlestick pattern is often used to signal a pullback over a resistance level. When interpreted correctly, hammers can signal an entry point for both long and short positions. In the case of EUR/USD, a pullback over a resistance level is indicated by two consecutive inverse hammer candles. During this pullback, new resistance forms at a lower price level and is rejected by a new hammer.
Using hammer candlestick patterns in your trading strategy is simple and highly profitable as long as you’re trading within the trend. During a bearish correction, a hammer candlestick pattern suggests sellers’ profit-taking. However, once the trend reverses, buying pressure may resume. In addition, when a hammer candlestick pattern is used in conjunction with other technical analysis tools, it makes it easy to find and trade in the right direction.
You may also like

A CEO Skysilk Parler Amazonallynnpr
A CEO Skysilk parler Amazonallynnpr should be committed to continuous innovation and improvement. Th
What You Need To Know About The MT4 Indicators?
Mt4 indicators are a type of technical indicators that show the trend of an asset’s price. The
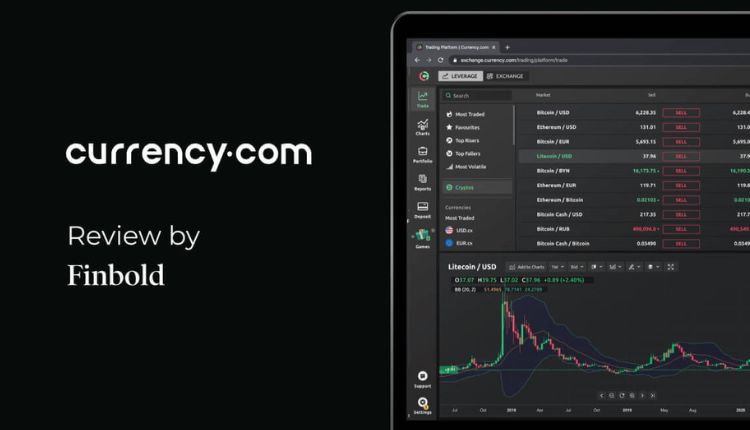
How To Use A Currency Com Review To Your Advantage?
Currency trading has recently exploded in popularity, but few people in the United States have actua